Contents
Scroll to:
The Journal is published online only. The frequency of releases is 4 times a year. 
The journal publishes the latest research in the field of clinical and basic medicine: pathological physiology, internal medicine and surgery.
https://doi.org/10.57256/2949-0715-2026-5-1-11-19
Scroll to:
Relevance. Non-invasive studies allow for effective assessment of cardiovascular health, stress levels, and overall physiological resilience. Heart rate variability, defined as fluctuations in the time intervals between successive heartbeats, allows for the study of autonomic nervous system activity. It reflects the dynamic balance between the sympathetic and parasympathetic branches of the autonomic nervous system, providing information that is a valuable biomarker in various fields, including cardiology, sports science, psychology, and occupational health.
Aim. To analyze the effective use of heart rate variability and summarize the obtained information to better inform physicians.
Materials and methods. A literature review was conducted using well-known databases such as the Russian Science Citation Index and PudMed covering a 10-year period.
Results. Heart rate variability is the variation in the time intervals between successive heartbeats and is a noninvasive indicator of autonomic nervous system activity. It reflects the dynamic balance between the sympathetic and parasympathetic branches of the autonomic nervous system, providing information about cardiovascular health, stress levels, and overall physiological resilience. Heart rate variability has become a valuable biomarker in various fields, including cardiology, sports science, psychology, and occupational health. High heart rate variability is generally associated with good health and adaptability, while low heart rate variability may indicate stress, fatigue, or pathological conditions.
Conclusion: Advances in wearable technologies and data analysis have facilitated real-time heart rate variability monitoring, opening up broader possibilities for clinical and personal healthcare applications. This article reviews the physiological basis of heart rate variability, common measurement methods, clinical significance, and current trends in heart rate variability research and application.
Gupta K., Saini R., Saini R., Sharma A. MEASURING HEART RATE VARIABILITY: INSIGHTS FOR CLINICIANS AND RESEARCHERS. Baikal Medical Journal. 2026;5(1):11-19. https://doi.org/10.57256/2949-0715-2026-5-1-11-19
Relevance
Over the past two decades, the correlation between the autonomic nervous system and cardiovascular mortality – particularly the incidence of sudden cardiac death – has become increasingly evident. A multitude of experimental investigations reveal that aberrant patterns in autonomic activity – whether characterized by excessive sympathetic stimulation or a diminished vagal influence–can significantly elevate the risk of fatal arrhythmias. This understanding has catalysed the advancement of objective methodologies to quantify autonomic function.
Among these, Heart Rate Variability (HRV) has emerged as one of the most promising indicators. Due to the ease with which HRV can be derived – often automatically by commercial electrocardiogram (ECG) devices – it has gained popularity in both clinical and research settings. However, interpreting HRV data correctly is more complicated than it may appear. Misunderstandings or over-interpretation of the various HRV metrics are common [1-3].
Aim. To analyze the effective use of heart rate variability and summarize the obtained information to better inform physicians.
Materials and methods. A literature review was conducted using well-known databases such as the Russian Science Citation Index and PudMed covering a 10-year period.
Results
Defining Heart Rate Variability (HRV)
It focuses on the fluctuations in the time intervals between consecutive heartbeats, known as RR intervals, as well as changes in moment-to-moment heart rate. Although other terms – like «cycle length variability» or «heart period variability» - have appeared in literature, «Heart Rate Variability» (HRV) is the most widely adopted [4].
Later in the 1970s, researchers found that our heart rate contains built – in rhythms that reflect how the body’s nervous system is working. Around that time, simple bedside tests were created to check short-term heart rate changes in people with diabetes, which helped detect damage to their nerves [5].
In 1977, scientists discovered that patients who had a heart attack and showed lower HRV were more likely to die afterward. This made HRV a powerful tool for predicting heart problems. Then in 1981, a method called power spectral analysis was introduced. It breaks down heart rate signals into different frequency ranges and gave a better understanding of how the nervous system controls the heart from beat to beat. By the late 1980s, it became clear that HRV could predict who might be at higher risk of death after a heart attack. Thanks to new digital devices that can record heart activity for 24 hours, HRV became even more useful for doctors and researchers to study heart health in everyday life [6].
One of the easiest ways to measure HRV is by looking at how the heart rate changes over time – this is called time domain analysis. In a continuous heart recording (like an ECG), each heartbeat creates a spike (called the QRS complex). We measure the time between these spikes—specifically the time between two normal heartbeats, called the NN interval (short for «normal-to-normal»).
From this, we can calculate simple things like: The average time between heartbeats (mean NN), The average heart rate, The difference between the longest and shortest NN intervals, The difference between heart rate at night and during the day (table 1).
Some tests involve changing body position or breathing patterns (like the Valsalva maneuver, deep breathing, or tilting the body) to see how the heart responds in different conditions [7].
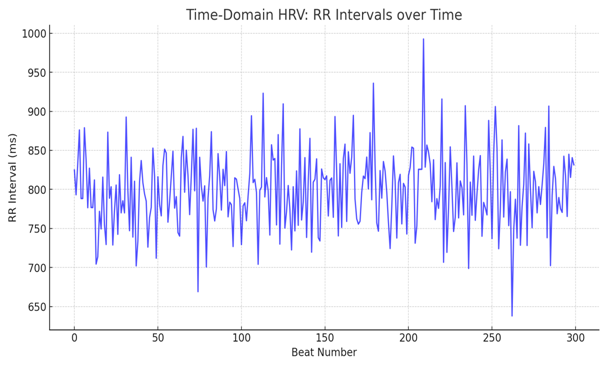
If we record heartbeats over a longer time (usually 24 hours), we can do more detailed statistical analysis. Based on the actual time between beats (NN intervals), Based on the differences between each beat and the next beat (fig.1, table 1).
Another way to analyze HRV is by looking at the shape and patterns made by the heartbeat intervals. These are called geometric methods. In these methods, the time between each heartbeat (the NN intervals) is turned into a visual shape, like a: Histogram (a bar graph of interval lengths) (fig.2), Lorenz plot (a type of scatter plot showing how each beat compares to the next), Triangle (used to estimate overall variability) [8].
Common Geometric HRV Measures
HRV Triangular Index: This counts the total number of NN intervals and divides it by the height of the most common interval (the tallest part of the histogram). It’s simple and works well with long-term recordings.
Pros and Cons of Geometric Methods
These methods are less sensitive to noise and small errors in data. They’re easy to use with large datasets or low-quality recordings. Disadvantages: They don’t work well with short recordings; you need enough data points (heartbeats) to form clear pattern.
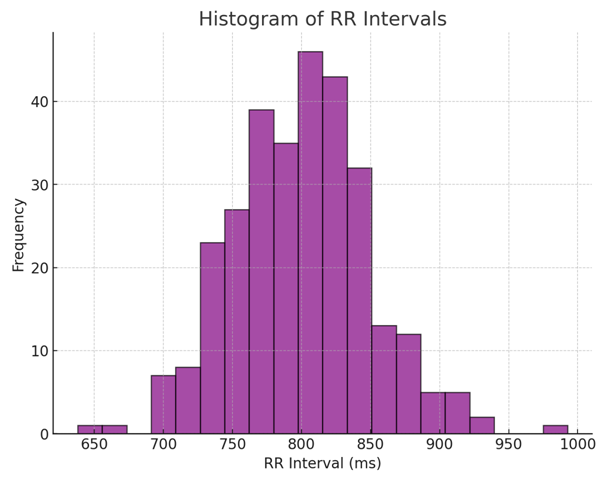
Table 1. Time Domain Measures
SDNN | Shows overall heart rate variability, Works best with long (24-hour) recordings |
HRV Triangular Index | Measures overall HRV |
TINN (Triangular Interpolation of NN Interval Histogram) | This measure the base width of a triangle fitted over the histogram of intervals. |
SDANN | Focuses on long-term changes (like over several minutes or hours |
RMSSD | Focuses on short-term changes (like beat-to-beat differences |
NN50 | Counts how many times the time between beats changes by more than 50 milliseconds |
pNN50 | The percentage of these larger changes compared to the total number of beats |
Besides measuring HRV over time, another popular way is to break it down by frequency – in other words, how fast or slow certain patterns in heart rate happen. This is called frequency domain analysis. Frequency analysis looks at how much «power» (or energy) is in each range of heart rate changes (fig.3).
There are two main types of methods:
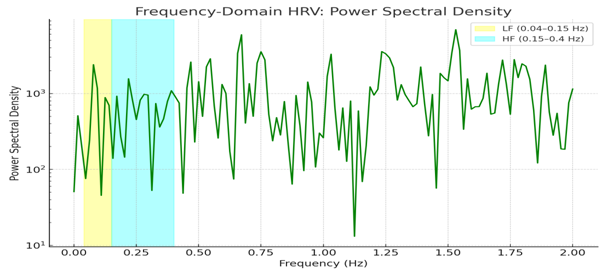
Sometimes, LF and HF are shown as percentages of total power (ignoring VLF). This helps show the balance between sympathetic and parasympathetic systems more clearly.
How Spectral Data Is Calculated
There are a few different ways to prepare the heartbeat data for frequency analysis:
Standards for Software Algorithms
For nonparametric methods (like FFT), the software should report:
For parametric methods (like AR models), the software should include:
Without this information, it’s hard to know if the HRV analysis is accurate or meaningful.
When you measure HRV over a short period (like 5 minutes), frequency domain methods (LF, HF, etc.) often give more detailed insight than time domain methods. That’s because they break the signal into parts tied directly to nervous system activity (table 2).
When you measure over 24 hours, both time domain (like Standard Deviation of Normal-to-Normal intervals (SDNN)) and frequency domain (like LF, HF, VLF, ULF) often tell very similar stories. They’re strongly correlated—meaning they tend to rise and fall together—because of how the body behaves over a whole day.
These methods can be especially helpful when studying how heart rate responds to breathing, blood pressure, or sudden events like stress or arrhythmia.
Table 2. Frequency domain measures [14]
HF (High Frequency) | Linked to breathing and vagal (parasympathetic) activity |
LF (Low Frequency) | May reflect both sympathetic and parasympathetic input, sometimes used to measure sympathetic activity, especially when expressed in "normalized units" |
VLF (Very Low Frequency) | unclear |
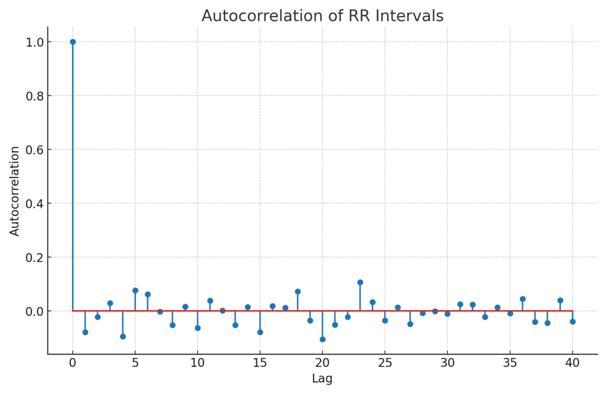
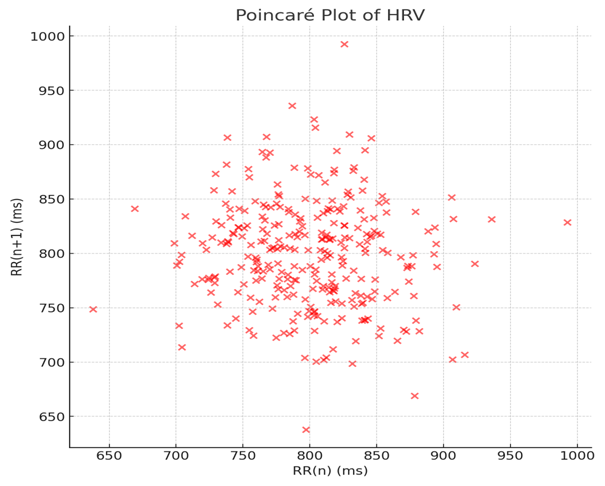
The heart’s rhythm is not purely mechanical – it involves complex biological systems. So, researchers have tried to use nonlinear math (from chaos theory and complex systems science) to dig deeper into HRV (fig.4).
HRV is influenced by how the autonomic nervous system controls your heart. This system has two main parts:
At rest, the vagal system dominates, which is why healthy HRV is often a sign of strong parasympathetic (vagal) tone.
HRV Frequency Bands [15]
LF is often misunderstood. During stress, total HRV can drop, making it look like LF stays the same – even though sympathetic activity is rising.
Increases in LF (normalized units):
Increases in HF:
HRV tells us about fluctuations in nervous system activity – not the total amount. A heart can have low HRV both if it's overly stressed or if it has no activity at all.
HRV has been studied in many health conditions, but right now, there are two key areas where it's widely accepted and used in clinical practice:
In diabetes, damage to the nerves that control the heart can happen before symptoms appear. This is called diabetic autonomic neuropathy (DAN).
Other Clinical and Research Possibilities for HRV
HRV changes depending on: Day vs. night cycles, Different stages of sleep, especially REM and deep sleep, Shift work and jet lag. In healthy people, vagal activity (HF) increases during deep (non-REM) sleep. But in people with heart disease, this nighttime increase may be missing [19,20].
HRV may help track: Physical conditioning during training, Recovery after illness or heart attack, Deconditioning due to bed rest or space travel [21, 22].
HRV can help doctors understand how drugs affect the nervous system. Examples: High-dose atropine: Decreases HRV (blocks vagal activity), Low-dose scopolamine: Increases HRV (boosts vagal tone), Beta-blockers: Usually increase HRV and reduce sympathetic activity, many other drugs (like calcium channel blockers, sedatives, and chemotherapy) haven’t been studied enough for their effect on HRV[23, 24].
HRV might help predict death risk in people with, Heart failure, Heart valve problems, Genetic arrhythmia disorders (like long QT syndrome), Neurological conditions (like Parkinson’s, Multiple sclerosis, or spinal cord injury) [25,26].
Future Directions and Research Goals for HRV [27]
Although HRV has already proven useful, there’s still a lot to learn and improve. Here are the top goals for future research: Improve HRV Recording and Analysis Tools, Make devices more accurate, affordable, and easy to use, Build better editing software to clean ECG signals and remove errors like ectopic beats, Improve algorithms for automated HRV analysis in real time, Collect More Population Data, Study large groups of healthy people to define what «normal» HRV looks like at different {Ages, Genders, Activity levels}, Expand Use in Disease Prediction and Management, Standardize Clinical Use, Explore New HRV Methods etc. [28].
Conclusion
HRV is a powerful, non-invasive tool that reflects how well the nervous system is controlling the heart. It has clear value in risk assessment after heart attacks, early detection of diabetic nerve damage, potential future roles in many other diseases and conditions. To use HRV effectively, we need to: Standardize how it's measured and analysed, Train clinicians and researchers on how to interpret it, Keep improving the tools and science behind it. With further research and better technology, HRV could become a routine part of medical care.
1. Heart rate variability: standards of measurement, physiological interpretation and clinical use. Task Force of the European Society of Cardiology and the North American Society of Pacing and Electrophysiology. Circulation. 1996;93(5):1043-1065. https://doi.org/10.1161/01.CIR.93.5.1043
2. McCraty R., Shaffer F. Heart Rate Variability: New Perspectives on Physiological Mechanisms, Assessment of Self-regulatory Capacity, and Health risk. Glob Adv Health Med. 2015;4(1):46-61. https://doi.org/10.7453/gahmj.2014.073
3. Thayer J.F., Ahs F., Fredrikson M. et al. A meta-analysis of heart rate variability and neuroimaging studies: implications for heart rate variability as a marker of stress and health. Neurosci Biobehav Rev. 2012;36(2):747-756. https://doi.org/10.1016/j.neubiorev.2011.11.009
4. Williams D.P., Koenig J., Carnevali L. et al. Heart rate variability and inflammation: A meta-analysis of human studies. Brain Behav Immun. 2019;80:219-226. https://doi.org/10.1016/j.bbi.2019.03.009
5. Pizzoli S.F.M., Marzorati C., Gatti D. et al. A meta-analysis on heart rate variability biofeedback and depressive symptoms. Sci Rep. 2021;11(1):6650. https://doi.org/10.1038/s41598-021-86149-7
6. Immanuel S., Teferra M.N., Baumert M., Bidargaddi N. Heart Rate Variability for Evaluating Psychological Stress Changes in Healthy Adults: A Scoping Review. Neuropsychobiology. 2023;82(4):187-202. https://doi.org/10.1159/000530376
7. Kim H.G., Cheon E.J., Bai D.S. et al. Stress and Heart Rate Variability: A Meta-Analysis and Review of the Literature. Psychiatry Investig. 2018;15(3):235-245. https://doi.org/10.30773/pi.2017.08.17
8. Voss A., Schroeder R., Heitmann A., Peters A., Perz S. Short-term heart rate variability--influence of gender and age in healthy subjects. PLoS One. 2015;10(3):e0118308. https://doi.org/10.1371/journal.pone.0118308
9. Shaffer F., Ginsberg J.P. An Overview of Heart Rate Variability Metrics and Norms. Front Public Health. 2017;5:258. https://doi.org/10.3389/fpubh.2017.00258
10. Peng C.K., Havlin S., Hausdorff J.M. et al. Fractal mechanisms and heart rate dynamics. Long-range correlations and their breakdown with disease. J Electrocardiol. 1995;28 Suppl:59-65. https://doi.org/10.1016/s0022-0736(95)80017-4
11. Heart rate variability: standards of measurement, physiological interpretation and clinical use. Task Force of the European Society of Cardiology and the North American Society of Pacing and Electrophysiology. Circulation. 1996;93(5):1043-1065. https://doi.org/10.1161/01.CIR.93.5.1043
12. Rajendra Acharya U., Paul Joseph K., Kannathal N. et al. Heart rate variability: a review. Med Biol Eng Comput. 2006;44(12):1031-1051. https://doi.org/10.1007/s11517-006-0119-0
13. Plews D.J., Laursen P.B., Stanley J. et al. Training adaptation and heart rate variability in elite endurance athletes: opening the door to effective monitoring. Sports Med. 2013;43(9):773-781. https://doi.org/10.1007/s40279-013-0071-8
14. Stanley J., D'Auria S., Buchheit M. Cardiac parasympathetic activity and race performance: an elite triathlete case study. Int J Sports Physiol Perform. 2015;10(4):528-534. https://doi.org/10.1123/ijspp.2014-0196
15. Buchheit M. Monitoring training status with HR measures: do all roads lead to Rome?. Front Physiol. 2014;5:73. https://doi.org/10.3389/fphys.2014.00073
16. Flatt A.A., Esco M.R. Evaluating Individual Training Adaptation With Smartphone-Derived Heart Rate Variability in a Collegiate Female Soccer Team. J Strength Cond Res. 2016;30(2):378-385. https://doi.org/10.1519/JSC.0000000000001095
17. Bellenger C.R., Fuller J.T., Thomson R.L. et al. Monitoring Athletic Training Status Through Autonomic Heart Rate Regulation: A Systematic Review and Meta-Analysis. Sports Med. 2016;46(10):1461-1486. https://doi.org/10.1007/s40279-016-0484-2
18. Kiviniemi A.M., Hautala A.J., Kinnunen H., Tulppo M.P. Endurance training guided individually by daily heart rate variability measurements. Eur J Appl Physiol. 2007;101(6):743-751. https://doi.org/10.1007/s00421-007-0552-2
19. Vesterinen V., Nummela A., Heikura I. et al. Individual Endurance Training Prescription with Heart Rate Variability. Med Sci Sports Exerc. 2016;48(7):1347-1354. https://doi.org/10.1249/MSS.0000000000000910
20. Troitskaya E. A., Velmakin S. V., Goreva L. A., Kobalava Zh. D. Aortic-brachial stiffness mismatch as potential marker of subclinical arterial damage in patients with rheumatoid arthritis. RUDN Journal of Medicine. 2023; 27(2): 167-181. https://doi.org/10.22363/2313-0245-2023-27-2-167-181.
21. Usman M., Rajagopalan P., Beck A., Nathania J., Li T., Lim T. W. Impact of Demographics on Short-term Heart Rate Variability for Detecting Hypertension.Computing in Cardiology.2021; 1-4, https://doi.org/10.23919/CinC53138.2021.9662722.
22. Shaffer F., Ginsberg J.P. An Overview of Heart Rate Variability Metrics and Norms. Front. Public Health.2021; 5:258. https://doi.org/10.3389/fpubh.2017.00258
23. Anglem N., Lucas S. J., Rose E. A., Cotter, J. D. Mood, illness and injury responses and recovery with adventure racing. Wilderness Environ. Med. 2019; 30–38. https://doi.org/10.1580/07-WEME-OR-091.1
24. Skinner J.E., Weiss D.N., Anchin J.M. Nonlinear PD2i heart rate complexity algorithm detects autonomic neuropathy in patients with type 1 diabetes mellitus.Clin Neurophysiol. 2011;122 (7):1457-62. https://doi.org/10.1016/j.clinph.2010.12.046
25. Sucharita S., Bantwal G., Idiculla J. Autonomic nervous system function in type 2 diabetes using conventional clinical autonomic tests, heart rate and blood pressure variability measures. Endocrinol Metab. 2011;15 (3):198-203. https://doi.org/10.4103/2230-8210.83406
26. Pal G.K., Shyma P., Habeebullah S. Vagal withdrawal and sympathetic overactivity contribute to the genesis of early-onset pregnancy-induced hypertension. Int J Hypertens. 2011;36:14-17. https://doi.org/10.4061/2011/361417
27. Ziep B., Taratukhin E.O. Heart rate variability assessment and its potential. Russian Journal of Cardiology. 2011;(6):69-75. (In Russ.) https://russjcardiol.elpub.ru/jour/article/view/1177?locale=ru_RU
Professor, Department of Physiology
PhD Scholar, Department of Physiology
MSc student, Department of Physiology
PG Resident, Department of Physiology
Gupta K., Saini R., Saini R., Sharma A. MEASURING HEART RATE VARIABILITY: INSIGHTS FOR CLINICIANS AND RESEARCHERS. Baikal Medical Journal. 2026;5(1):11-19. https://doi.org/10.57256/2949-0715-2026-5-1-11-19
664003, Irkutsk, Krasnogo Vosstaniya street, 1
Processing of personal data